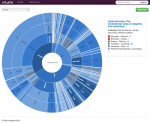
New PlumX Feature: Enhanced Researcher Visualizations / Metrics Previews

From the beginning of our company’s history, we’ve focused on not just the data, but being able to visualize and quickly discover the stories that are contained in it. Per researcher, one question that often gets asked is. “What has that researcher done that has gotten the most engagement?” Our sunburst visualization can be sorted by impact to weight the artifacts (articles, Read More