Get Deeper Insights with PlumX Analytics Improved Filtering and Excel Export
The Analytics Reports within the PlumX Suite help users gain insights, drive decision-making and understand where the interesting stories in a body of research are taking place. Two recently-released improvements to these reports add flexibility and allow you to see and dive into the altmetrics for your research corpus, and even export them for further analysis offline.
Filtering PlumX’s New Productivity Report
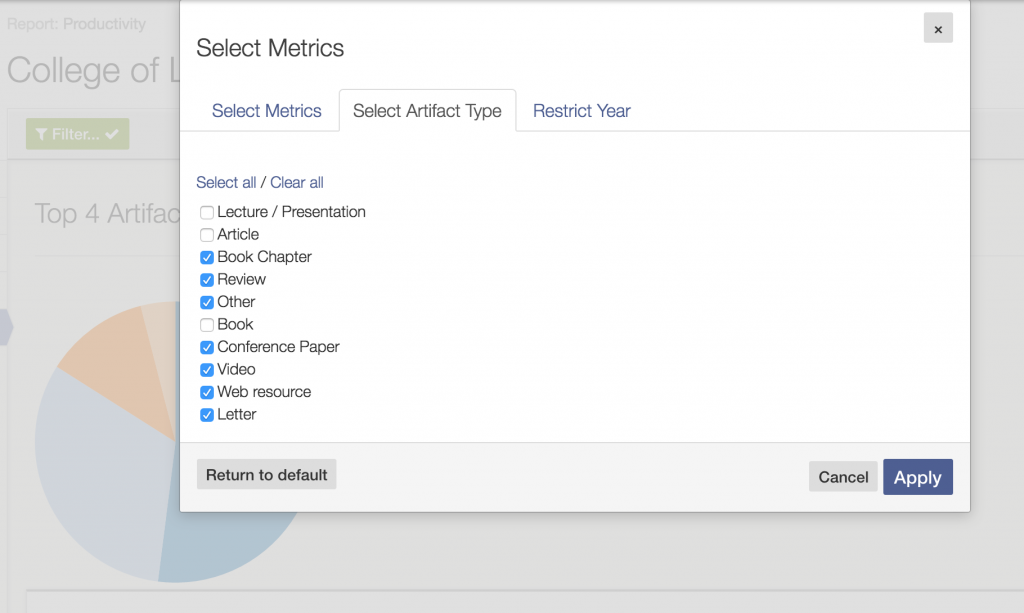
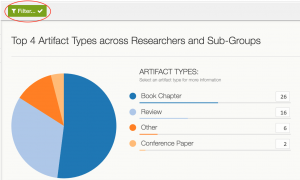
Using the recently-released Productivity Reporting, PlumX users can examine, compare and rank researchers, groups or grants by the number and type of academic output. You can now easily filter the Productivity Report results by publication date and artifact type. Whether you are interested in publications from a particular year, or want to focus on non-article content in your body of research, you can simply select the date range or artifact types to include.
To filter any PlumX report, click the ‘Filter’ button in the upper right corner of the report view. This button will turn green and display a checkmark if any filters are currently active within the report.
Exporting Reports to Microsoft Excel
Now that users can filter any of the PlumX Suite analytics reports, what if you’d like to export the underlying data for further analysis in other tools or to include in a report or presentation? We’ve expanded our report export options from PDF and image files to include export to Microsoft Excel. While our Researcher, Subgroup and Grant reports show a visual overview of the top 20 researchers, subgroups or grants, the Excel export includes altmetrics for every researcher, subgroup or grant, no many how many are associated with the group you are reporting on.
With complete reporting on all your productivity and altmetrics data at your fingertips, we’re eager to see what insights users find and visualizations they create. Interested in sharing some analytical insights or innovative visual analysis of your altmetrics data? Tweet us at @plumanalytics and share your stories.