Harvard Profiles and PlumX
PlumX Dashboards integrates with Harvard Profiles, an open source research networking software created by The Harvard Clinical and Translational Science Center, allowing us to populate your PlumX Dashboard with:
- Your organizational hierarchy
- Your researcher profiles
- Your publication data (using PMIDs to generate artifacts)
If you decide to use Harvard Profiles, you will provide us with a monthly output of spreadsheets containing researcher and publication data via FTP.
Organizational Hierarchy Replication
One of the first things we do is work with you to determine if the school and department names associated with the researcher profiles in your Harvard Profiles site is what you’d like to use to organize your artifacts in PlumX. If those are sufficient, we will use them to create a hierarchy in your PlumX site. If you wish to use a custom hierarchy, your PlumX implementation specialist can provide you with a spreadsheet template for you to add your hierarchy, researchers, and additional information.
Once we bring in your organization list you will be able to compare the metrics for each level of the hierarchy against each another (i.e., compare the College of Agriculture and Life Sciences to the College of Geosciences).
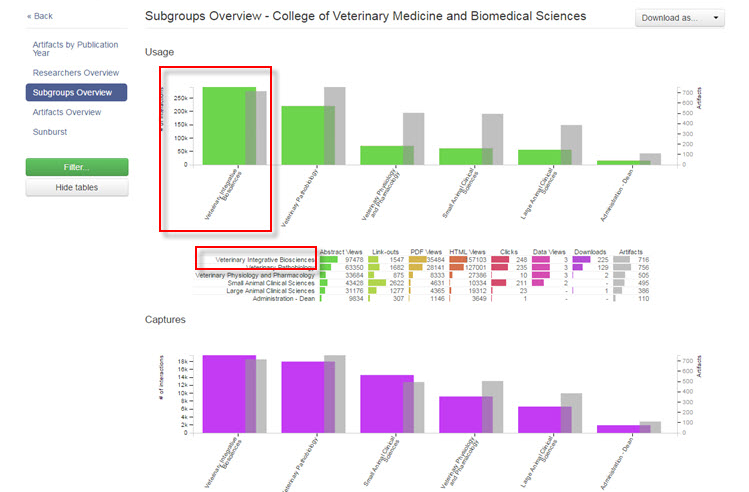
You can compare these subgroups in the Subgroups Overview Report in PlumX Dashboard. The Subgroups Overview Report provides a view into each subgroup for your organization across our five metrics categories, creating a powerful benchmarking opportunity.
The subgroups report is purposely generically named and is based on where in the hierarchy you are currently located. It is often best used at least one level down from the highest level in your PlumX subgroups to get you the closest to comparing “like to like.” For example, consider the following top-level subgroups:

Each of these subgroups has their own subgroups below them, so a common use case would be to explore the results for each, such as for “Schools and Programs.”

After navigating to that level, the next step would be to click on the Analytics icon and then click on Subgroups Overview to see the results. For the Usage category in this example, the Veterinary Integrative Biosciences group has the most usage compared to the other schools in that college:
Note: This Subgroups Overview comparison is unique to a PlumX Dashboard subscription–a PlumX Metrics subscription does not include this type of report.
Researcher Profiles
When it comes to creating your researcher profiles, we’ll look at your Harvard Profiles researcher data in a sample researchers spreadsheet output you provide to us and create mappings to PlumX. Once the mappings are in place, we’ll provide you with a login name and password to our FTP server where you can upload monthly spreadsheets with the profile information that you have exported from Harvard Profiles. This export will also include school and department names.
Publications will be FTP’d in a separate spreadsheet and must include a PMID. If your publications can be exported with other identifiers (such as DOI), please let us know.
Researcher photo thumbnails can be included in PlumX researcher profiles. Please include the full thumbnail URL in your spreadsheet.
Key fields for mapping include:
- School
- Department
- PvID
- Profiles URL
- First name
- Last name
- Title
- Thumbnail (if including researcher photo)
Additional fields you wish to include should be discussed with your PlumX Implementation Specialist as well as how the columns should be ordered.
Artifacts
- RePEc handles and URLs
- SSRN Articles ID
- ArXiv IDs
- You can also provide URLs to your publications