Coverage
Expanding the World of Altmetrics
 From the beginning, Plum Analytics set an audacious goal to measure the world’s research. We are proud that we are coming closer and closer to that goal. We took a “snapshot” of where we are now (as of October 6, 2016).
In order to do thorough and meaningful analysis on research output you need a large corpus of that output.
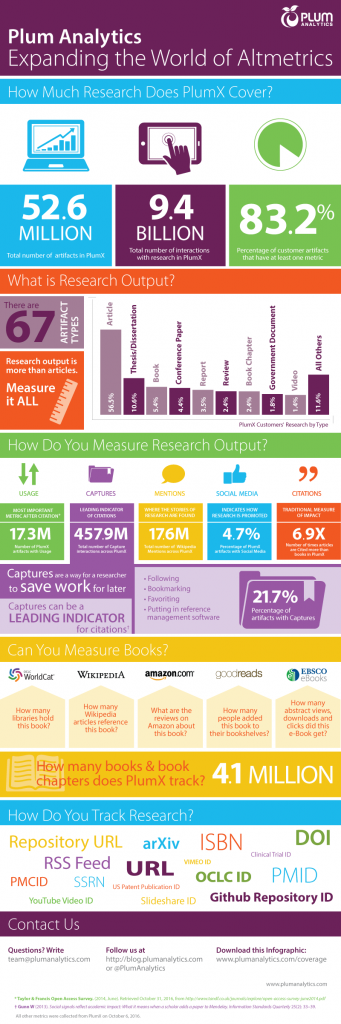
Plum Analytics strives to track as much research as possible. This means as many different research output types, also known as artifact types, as well as many individual pieces of research as possible.
As you can see, PlumX covers 52.6 million individual pieces of research output. In addition to journal articles, we also cover many other forms of research output including, books, presentations, videos, government documents, blog posts, and more.
Of all the research output that our customers have asked us to track, 83.2% of it has at least one metric. This is great news if you are a PlumX customer, because most likely if you have research we will have metrics that help you tell the story of that research.
PlumX has measured 9.4 Billion individual interactions with research. These interactions span the 5 categories of metrics that we track.
Why is this important?
In order to do meaningful analysis you need a large corpus; it is the only way to calculate statistically relevant comparisons. You cannot accurately say what is the top research article when only comparing to a small number of other research articles. Analysis goes far beyond which articles are the most popular. Analysis can come in the form of comparing groups of research or researchers. It can come in the form of in-depth productivity reports so you can see all of your institution’s output.
None of these types of analysis would be possible – or at least less relevant – without the large corpus of research that PlumX has.
Highlighted Facts:
- 4.7%: The percentage of PlumX artifacts that have Social Media. While many have conflated social media and altmetrics, the truth is Social Media actually makes up a relatively small fraction of all of the metrics we track about research.
- 4.1 Million: The number of Books and Book Chapters that are tracked in PlumX. Since citations do not do books justice, it is important to gather alternative metrics about the interest, reach and impact of this important type of research output.
- 17.6 Million: The number of Wikipedia Mentions across PlumX. Wikipedia is an increasingly important source of information for many people. Finding a reference to your article in Wikipedia tells an important story about the reach and interest in the research.
I hope we’ve piqued your curiosity.