NFAIS13 – key take aways on the value of data and metrics
The NFAIS conference wrapped up earlier this week. In years past, I often had coffee, dinner, drinks with attendees (since it is always in my home town of Philadelphia), but this is the first time I actually attended. I’m glad I did.
David Weinberger kicked off the conference with a rousing keynote. He spoke of the power of iterating on an idea when there are 100’s of millions of people making many small changes. The examples he gave of how software developers have created insanely productive learning environments through sites like Stack Overflow and GitHub really resonated with me.
He also talked about how the US government’s DATA.GOV initiative is a wonderful example of how if we waited for clean data to be shared, it would take too long to be useful, and cost too much to produce. Instead, it’s better to have big messy data now than to have a trickle of clean data now.
Laura Ricci, a market analyst from Outsell, spoke about creating value with metrics and analytics. She quoted the figure that in 2012, there was $1.4 trillion in research funding.
Laura Ricci: “research funding is becoming a winner take all game” #nfais13
When talking about what is new, she spoke of metrics being used to feed into new systems and people taking a “modular approach” with tools to get a picture of impact.
As far as the sorts of questions that metrics can solve:
- What to spend $ on
- Who to work with and hire
- What is the info we need to solve the problem
When Laura was speaking about altmetrics, I found myself nodding in agreement for much of the time. She talked about how altmetrics can “establish a currency to work across disciplines.” She also spoke about being able to tell “how powerful an article is before it is cited.” She also made a point from the point of view of publishers saying they “include article level metrics in their journals because researchers find them valuable.”
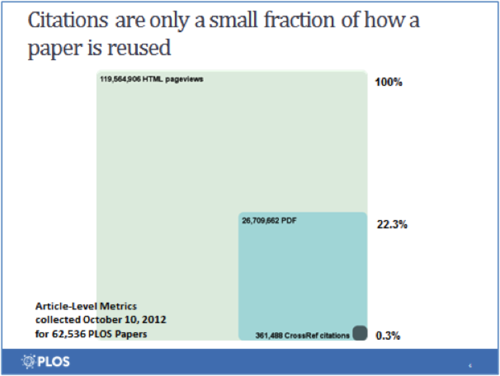
I presented later in the conference under the topic of, “Are Altmetrics Still Alternative?” I started with a discussion of how using citation counts as the only measure of impact and prestige only tells a very small fraction of the story about how a particular piece of research is being used.
This graphic from PLOS, shows how citations only account for 0.3% of the reuse of an article. Can 0.3% possibly tell the entire story?
At Plum Analytics, we gather metrics from 5 separate categories: usage, captures, mentions, social media, and of course, citations. The full description of each can be found here.
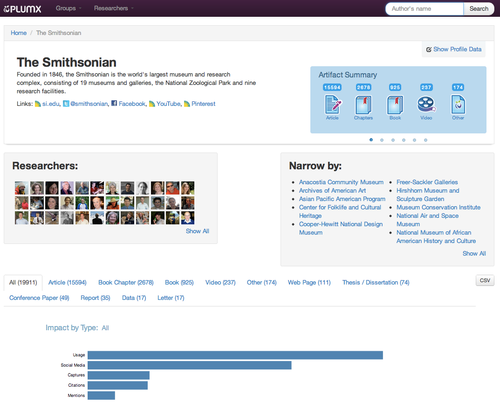
The Smithsonian, one of our customers, is using the data we gather to begin to generate reports on publication activity in support of research evaluation.
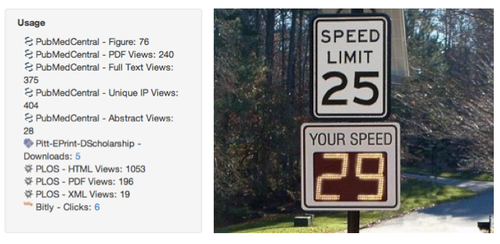
At the University of Pittsburgh, they signed up to be a Plum Analytics beta customer, in large part to support their open access activities. One of the powerful things about providing authors with metrics about how and where their work has been accessed, creates a feedback loop about their activities. Much like a speed limit sign on the side of the road, by giving authors immediate feedback about depositing their materials in open access, this can help to drive adoption.
The following is a tweet from William Gunn, Mendeley’s Head of Academic Outreach.
I like @amichalek’s concept of the Open Access Feedback Loop – access to stats changes behavior. #nfais13
I enjoyed the dialog on the future of metrics in research, and I’m sure it will continue. If you have examples of how you or your institution has used metrics about research output, I would love to hear them!