The Power of Being Able to See What You Could Only Imagine
In my 11th grade biology class, with my lab partner, we dissected a fetal pig. I remember the aha moment when I realized what the diaphragm was. I had taken clarinet lessons for many years, and my teacher would always tell me to “breathe more with your belly, fill up your diaphragm” I never quite understood what he was talking about, until, right before my eyes, I could see that thin layer of muscle that ran across the abdomen of the animal. And then, click, I understood.
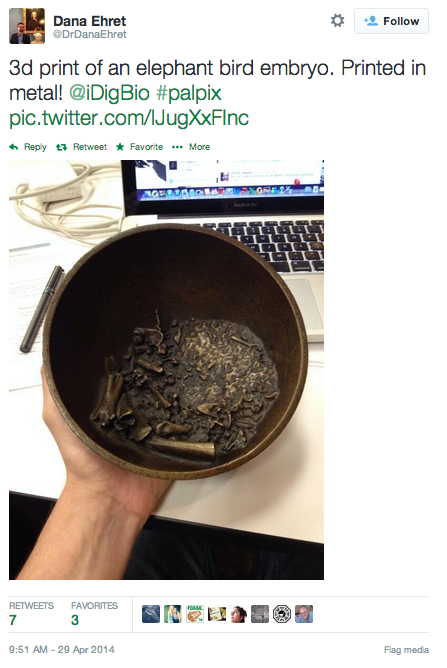
With the advent of 3D printing, it’s amazing to think of all of the other things we can now see, and understand, in the blink of an eye. For example, I saw this tweet recently:
With the work that we are doing at Plum Analytics, to visualize the impact of research, we are faced with a similar challenge. How do we push forward the bounds of what is visible? We sometimes compare the difference between what we measure with PlumX and altmetrics to visible light verus the full electromagnetic spectrum.


For centuries, all that people could see and measure was the visible light spectrum. As instrumentation progressed, and better measurement tools were developed, we can now measure more.
For decades, the only tools that were instrumented to measure the impact of research came a time when journals were printed. Measuring the quality of the journal that it was printed in, and the number of times other journal articles cited that work, was all that you could see and measure.
Now, with researchers and lay people interacting with research online, a whole new era of measurement can be possible. We can discover who is interacting with the work, how much, across what channels, etc. This enables us to better tell the stories behind the research that is being performed.
We love hearing your stories of how having access to this sort of data has enabled you to see what you could only imagine. Please drop us a line at hello@plumanalytics.com.