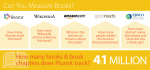
We recently created an infographic to describe the research and metrics that PlumX covers. In that process we took a look at how many books and book chapters PlumX tracks. As you can see above, PlumX tracks 4.1 million books and book chapters. Read More
Dog Days of Summer have you on vacation? Not so much in altmetrics and definitely not here at Plum Analytics. Our development team has been very busy in the last four months. We’ve announced a lot of PlumX product news. Here’s a quick round up of our important product developments: Clinical Citations (May 12, Read More
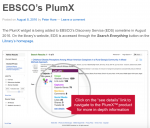
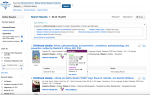
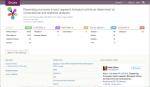
On June 23rd we announced that we were adding altmetrics via the PlumTM Print to EBSCO Discovery ServiceTM (EDS). I am pleased to say that this is complete and the Plum Print is now visible in the result list and on the detail page. Read More
Today we announced adding the PlumTM Print to EBSCO Discovery ServiceTM (EDS) and EBSCOhost® databases. The Plum Print is a visualization of the altmetrics gathered for each research artifact. Read More
We are at the Open Repositories meeting in Indianapolis, IN this week and are talking to many institutions about their repositories and integrating modern metrics into them. We participated in the poster session on Tuesday evening with our poster, Read More
The integration between PlumX and DSpace makes it simple for DSpace customers to get started quickly to have PlumX metrics, dashboards and analytic reports. When we work with new customers to implement PlumX we always start with the best place for them. Read More
We are happy to announce a new artifact-level metrics page. An artifact is any piece of research output. Some of the most popular artifacts include: Article Blog Post Book Source Code Theses/Dissertation Video Below is the new Artifact-Level Metrics page. This is the largest redesign of PlumX to date. Read More
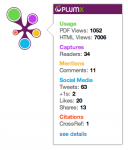
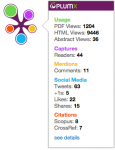
In honor of the Frankfurt Book Fair this week we want to review the PlumXTM widgets. The PlumTM Print is an article-level widget that visually changes based upon the metrics in each of the five categories of metrics. Read More
The key to quickly navigating complex data sets is to turn them into elegant, simple visualizations that do the hard work for you. We think our new PlumTM Print does exactly that. With one glance, it’s easy way to see the relative impact of each of the five categories of metrics – Read More