PlumX Benchmarks: How Do You Compare?
At Plum Analytics we often talk about telling the story of research. We mean many things by that. One of the things we mean is to use modern metrics to understand how your institution compares to its peers and leaders in any research field. By using this data and understanding the stories, you can find important information that helps you understand how you are doing, where to compete for funding, what communications need to be improved, and more.
This is why we built PlumX Benchmarks. To help you compare now.
In a previous blog post, we showed how PlumX Benchmarks’ new Overview tab can highlight the top five institutions across all five metric categories. But what if you want to compare your institution to these top five?
As an example, let’s compare the University of Southern California’s research to the top five institutions, focusing on research related to brain cancer. By adding USC as a benchmarked institution, we can see how it ranks in the context of the top five institutions in each metric category.
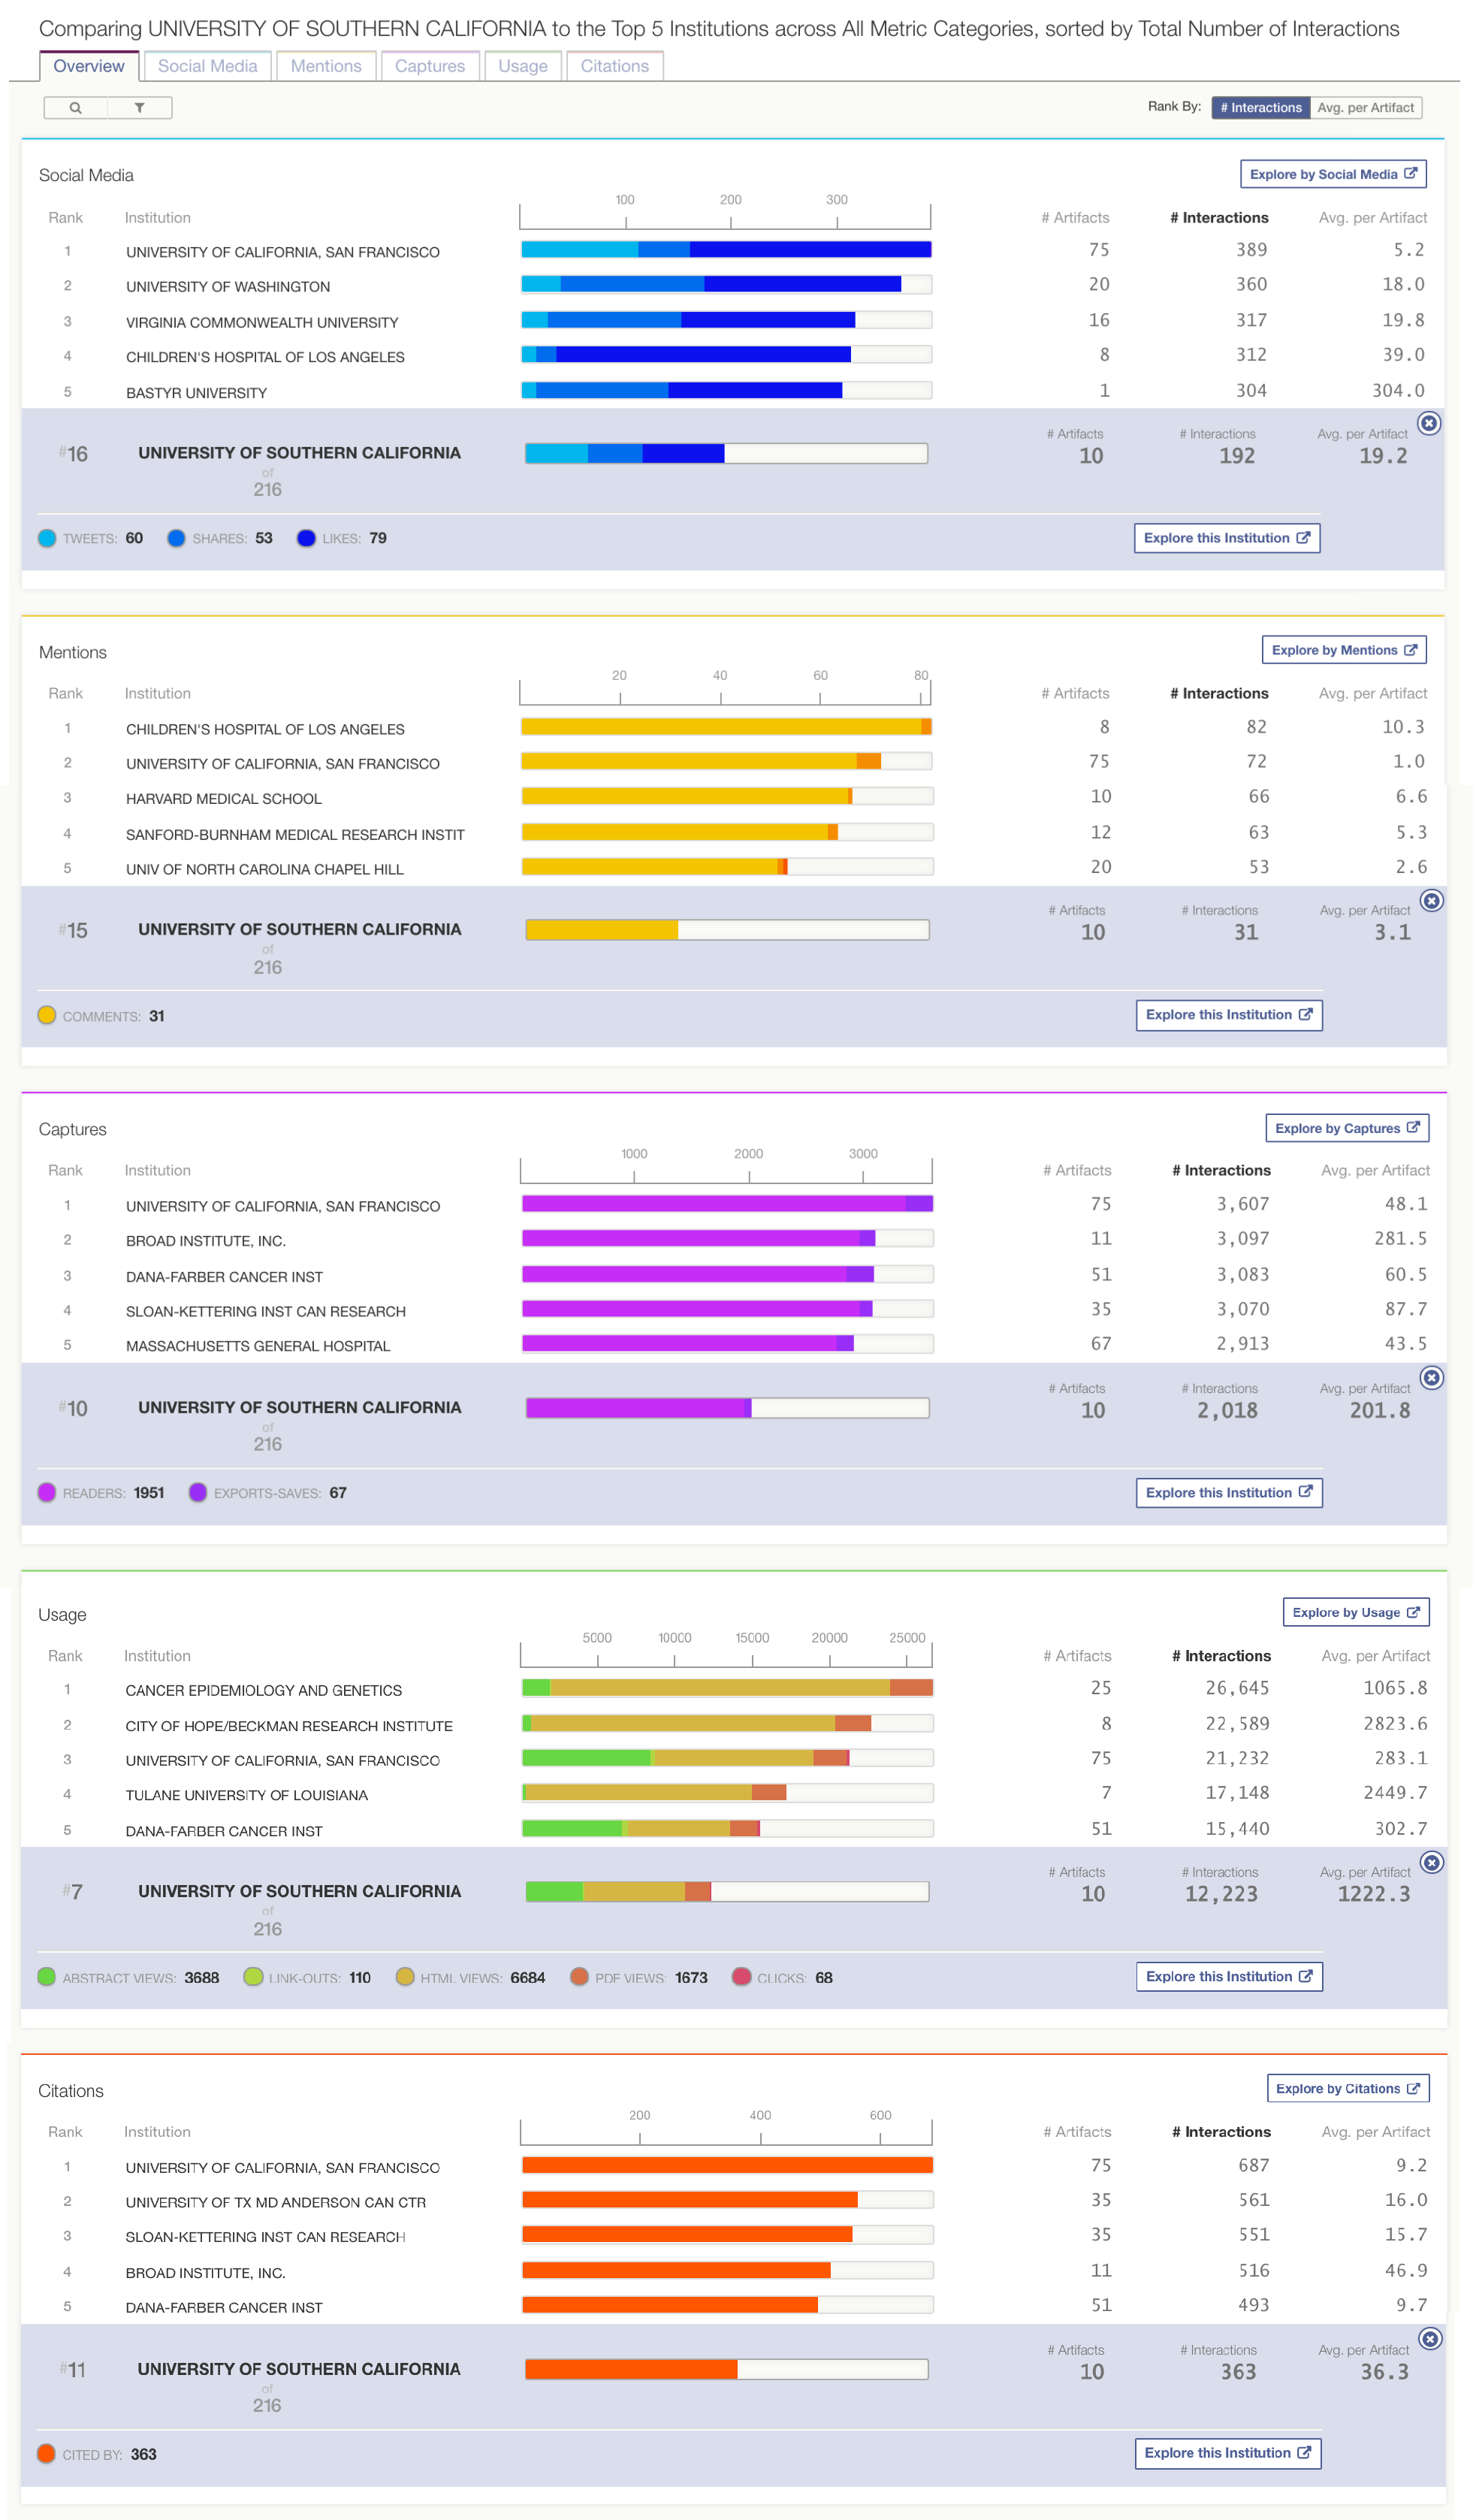
Today we also released a new feature in PlumX Benchmarks: the ability to filter results by publication year. The above screenshot compares only NIH-funded research published in 2014 that tagged with “Brain Cancer” as a spending category.
Stay tuned to understand how PlumX Benchmarks works when you want to go beyond comparing one institution to the top five in each category by selecting multiple peer institutions.