As 2016 gets well underway we have a lot exciting plans for all five of the PlumX Suite products. But, before we get too far ahead of ourselves, we want to take a moment and look back on some of the things we accomplished in 2015. Read More
If your New Year’s resolution was to learn a bit more about research metrics, we’re here to help. Meaningful Metrics The book Meaningful Metrics by Robin Chin Roemer & Rachel Borchardt was recently made available in open access and is 251 pages chock full of background reading about bibliometrics, Read More
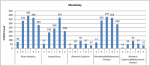
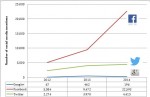
In a recent blog post from Mount Sinai, they reported results of an analysis they performed about social media and 7,000 articles authored by Icahn School of Medicine at Mount Sinai authors from 2012 – 2014 using PlumX Dashboards. Read More
We founded Plum Analytics with the vision of providing modern metrics to help anyone who performs, funds or publishes research, to tell the stories of their research through greater insight to what is happening with it around the world. Read More
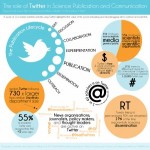
Today I saw a great infographic about Twitter and Science publications. You can read about the background of it here. In addition to the compelling graphic itself, something that I found interesting, was that the creator of the infographic only shared it directly on twitter to begin with. Read More
In our latest release of PlumX, we have made improvements to the display metrics of the impact of artifacts, researchers and groups they are affiliated with. Highlights include: metrics previews when searching for a researcher, a significant redesign to make the metrics on the data table more digestible, Read More
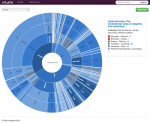
From the beginning of our company’s history, we’ve focused on not just the data, but being able to visualize and quickly discover the stories that are contained in it. Per researcher, one question that often gets asked is. “What has that researcher done that has gotten the most engagement?” Our sunburst visualization can be sorted by impact to weight the artifacts (articles, Read More
